
Science
|
Congrats! You are done with your SLO pre-test for 6th grade science. Get out your sugar cube lab in order to complete your graph. These steps will walk you through it: Step 1: Label your x-axis with the group numbers  Step 2: Label your y-axis with the time in seconds (make 10 second increments, I MESSED UP!!) You may need to add another row at the top 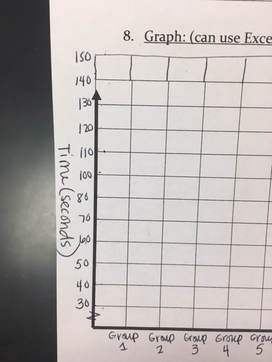 Step 3: Make a Key to show which color will represent your SOLID sugar cube and your WEATHERED sugar cube 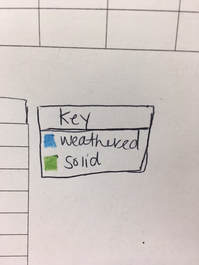 Step 4: Start graphing your points for each group. Graph ALL the points FIRST (I put a 'break' in the axis because I didn't start at zero. You can do that too if you want) 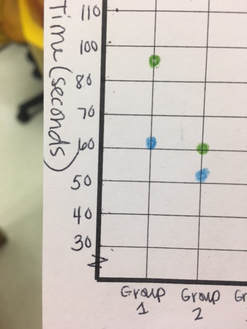 Step 5: Connect the dots that are the SAME color 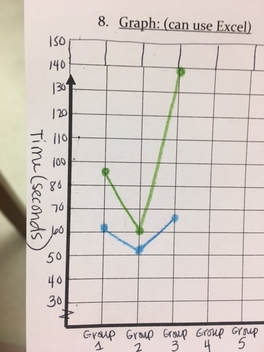 Step 6: You're done with your graph! Now answer the conclusion questions below on your sheet:
•Did the sugar dissolve at the same rate during both trials? Explain why or why not. •Do you think one large rock or several smaller rocks would wear away faster? Explain your answer. •Was your hypothesis correct? If not, what is your new IF… THEN statement?
0 Comments
Leave a Reply. |
AuthorWrite something about yourself. No need to be fancy, just an overview. Archives
May 2018
Categories |
 RSS Feed
